Blogs
XAS-spectra, mountains, and more XAS-spectra – my secondment at eawag in Switzerland
– By Melanie Münch –
As part of the lake-crew within the P-Trap project I will tell you about my favorite lake Terra Nova in the Netherlands again in this blog post. However, this time we will not look at blue water and nice water lilies, but at some crumbles on a piece of tape. I guess you slowly start to wonder what I am getting at. Let’s go back two or so years. Right after the first lock-down due to the Covid pandemic, we curiously followed a cue from Waternet about an interesting shallow peat lake just North of Utrecht. Because it is eutrophic, Waternet treated it with FeCl3 to bind the P in the sediment, but against expectations, the treatment only made the situation worse (for more details, read my blog on the secondment with Waternet). As the geochemists we are, we of course immediately went for a closer look at the sediment. We took sediment cores and conducted laboratory studies, trying to figure out what happened to the added Fe in the sediment and how it affected the P dynamics. This yielded very interesting results, that are currently under revision for publication. Our main finding was, that organic matter plays a key role in the stabilization but also cycling of reactive Fe in the sediment, with major effects on the P cycle within lake Terra Nova. However, we wanted to also collect some spectroscopic evidence to support this finding. So, we packed some powdered sediment into an air-tight bag and boarded the train to Grenoble.
The European Synchrotron Radiation Facility (ESRF) in Grenoble creates the high-energy X-ray beams needed to do X-ray absorption spectroscopy (XAS). This is a technique used to look at the immediate coordination environment and redox state of elements, which is very handy if one wants to know in detail which mineral phases are present in a sediment sample. We had the opportunity to do Fe K-edge and P K-edge measurements (which means that you, so to say, look at the sample from the eyes of the respective element) at the beamline ID21. We also took µ-XRF maps of interesting areas of the samples. A µ-XRF map is a raster scan of an area on a sample, where a spectrum is collected on each spot that reveals the elements that are present there. This is very valuable as it gives an idea about the morphology of the sample and shows which elements occur together. But, most importantly of course, these maps are very pretty 😉
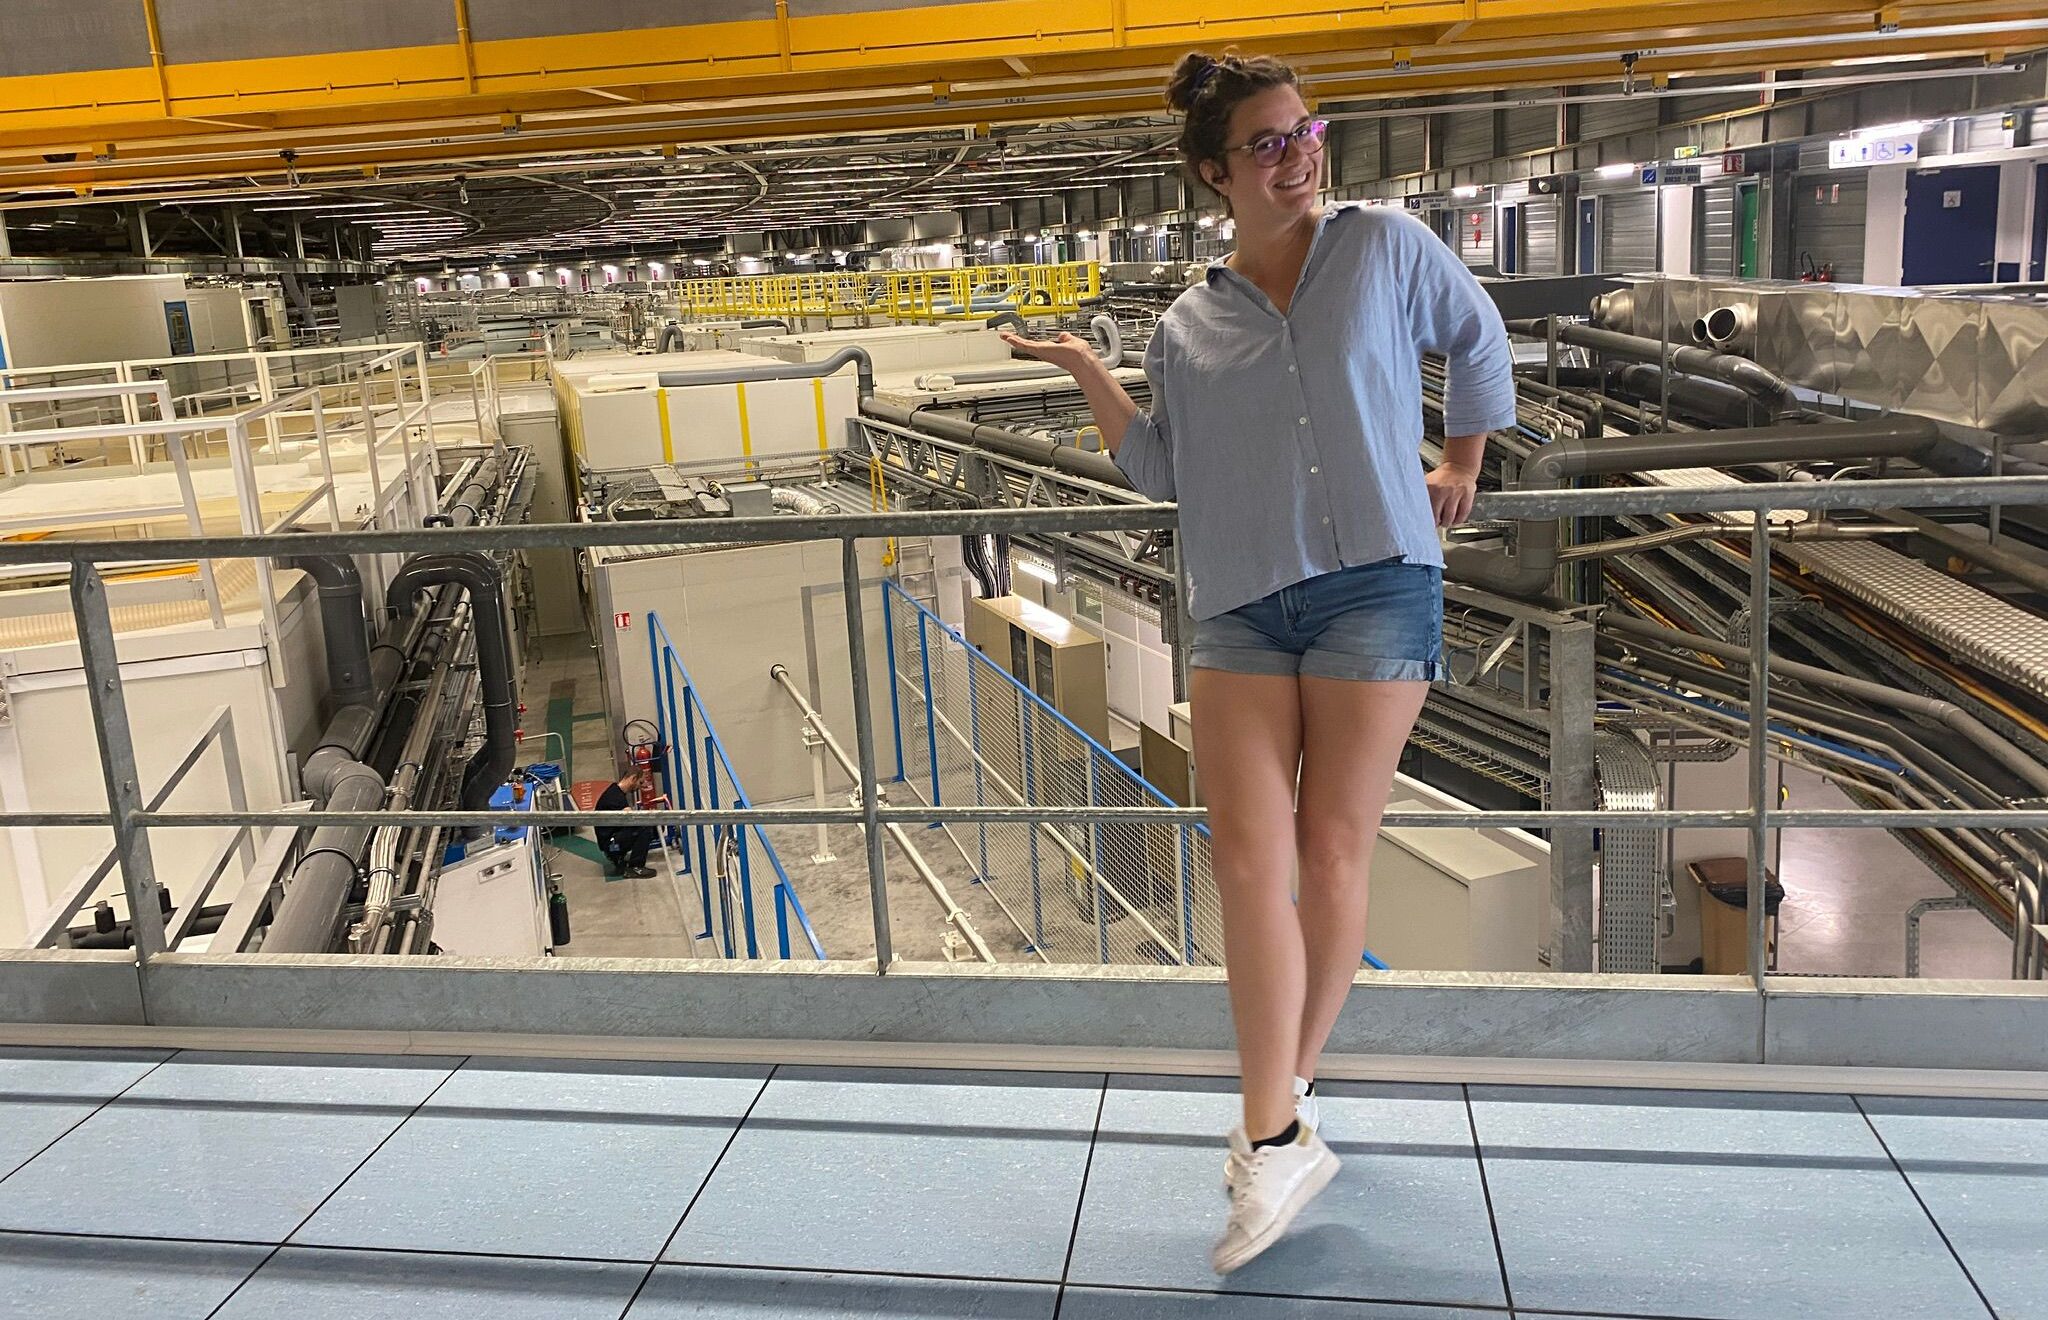
Me at the ESRF in Grenoble
As it tends to happen, we ended up collecting a lot of spectra and µ-XRF maps, a mountain of data which needed processing before it could be used and interpreted. Whom else to ask for help with this than our P-Trap internal expert Andreas Voegelin from Eawag in Switzerland? Thus, I spent an entire month in Dübendorf, ploughing through hundreds of spectra, while having fruitful and enjoyable discussions and lunch breaks with Andreas and Ville Nenonen (ESR 7). We wanted to figure out what where the main Fe phases present in the sediment and to see if we could confirm the interpretations that were based on our laboratory data. For this, the spectra needed to be clustered based on similarity and location at which they were taken. Subsequently, all clusters had to be fitted using sensible reference spectra. For example, in the surface sediment we were specifically on the hunt for Fe-(oxyhydr)oxides, and of course Fe(III) associated to organic matter. Both phases we expected to form when reduced Fe diffuses up from the deeper sediment and encounters oxygen, gets oxidized and precipitates or gets complexed by organic matter. Of course, this entire process needs detailed geochemical and technical knowledge and quite a bit of experience. I learned a lot from Andreas during my stay at Eawag and I am now compiling all the data we produced in a manuscript that will be part of my PhD thesis.
 |
 |
|
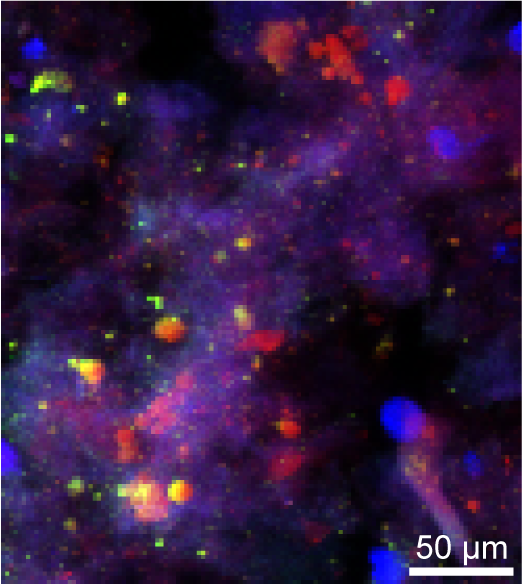
RGB-map of a sediment sample. red = Fe, green = S, blue = Ca. A yellow color reveals the presence of both Fe and S and purple of both Fe and Ca. |
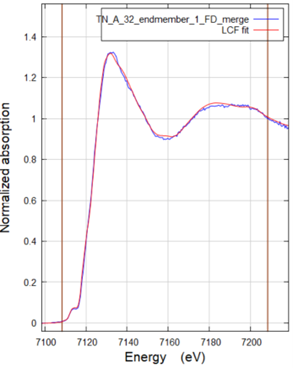
XANES-spectrum with linear combination fit (LCF) of a point spectrum taken in one of the maps. The LCF indicates that the Fe at this spot is present in the form of lepidocrocite, an Fe-(oxyhydr)oxide mineral, pyrite (FeS2) and monomeric Fe(II) coordinated to oxygen, as could for example be the case for Fe(II) complexed by the functional groups of organic matter. |
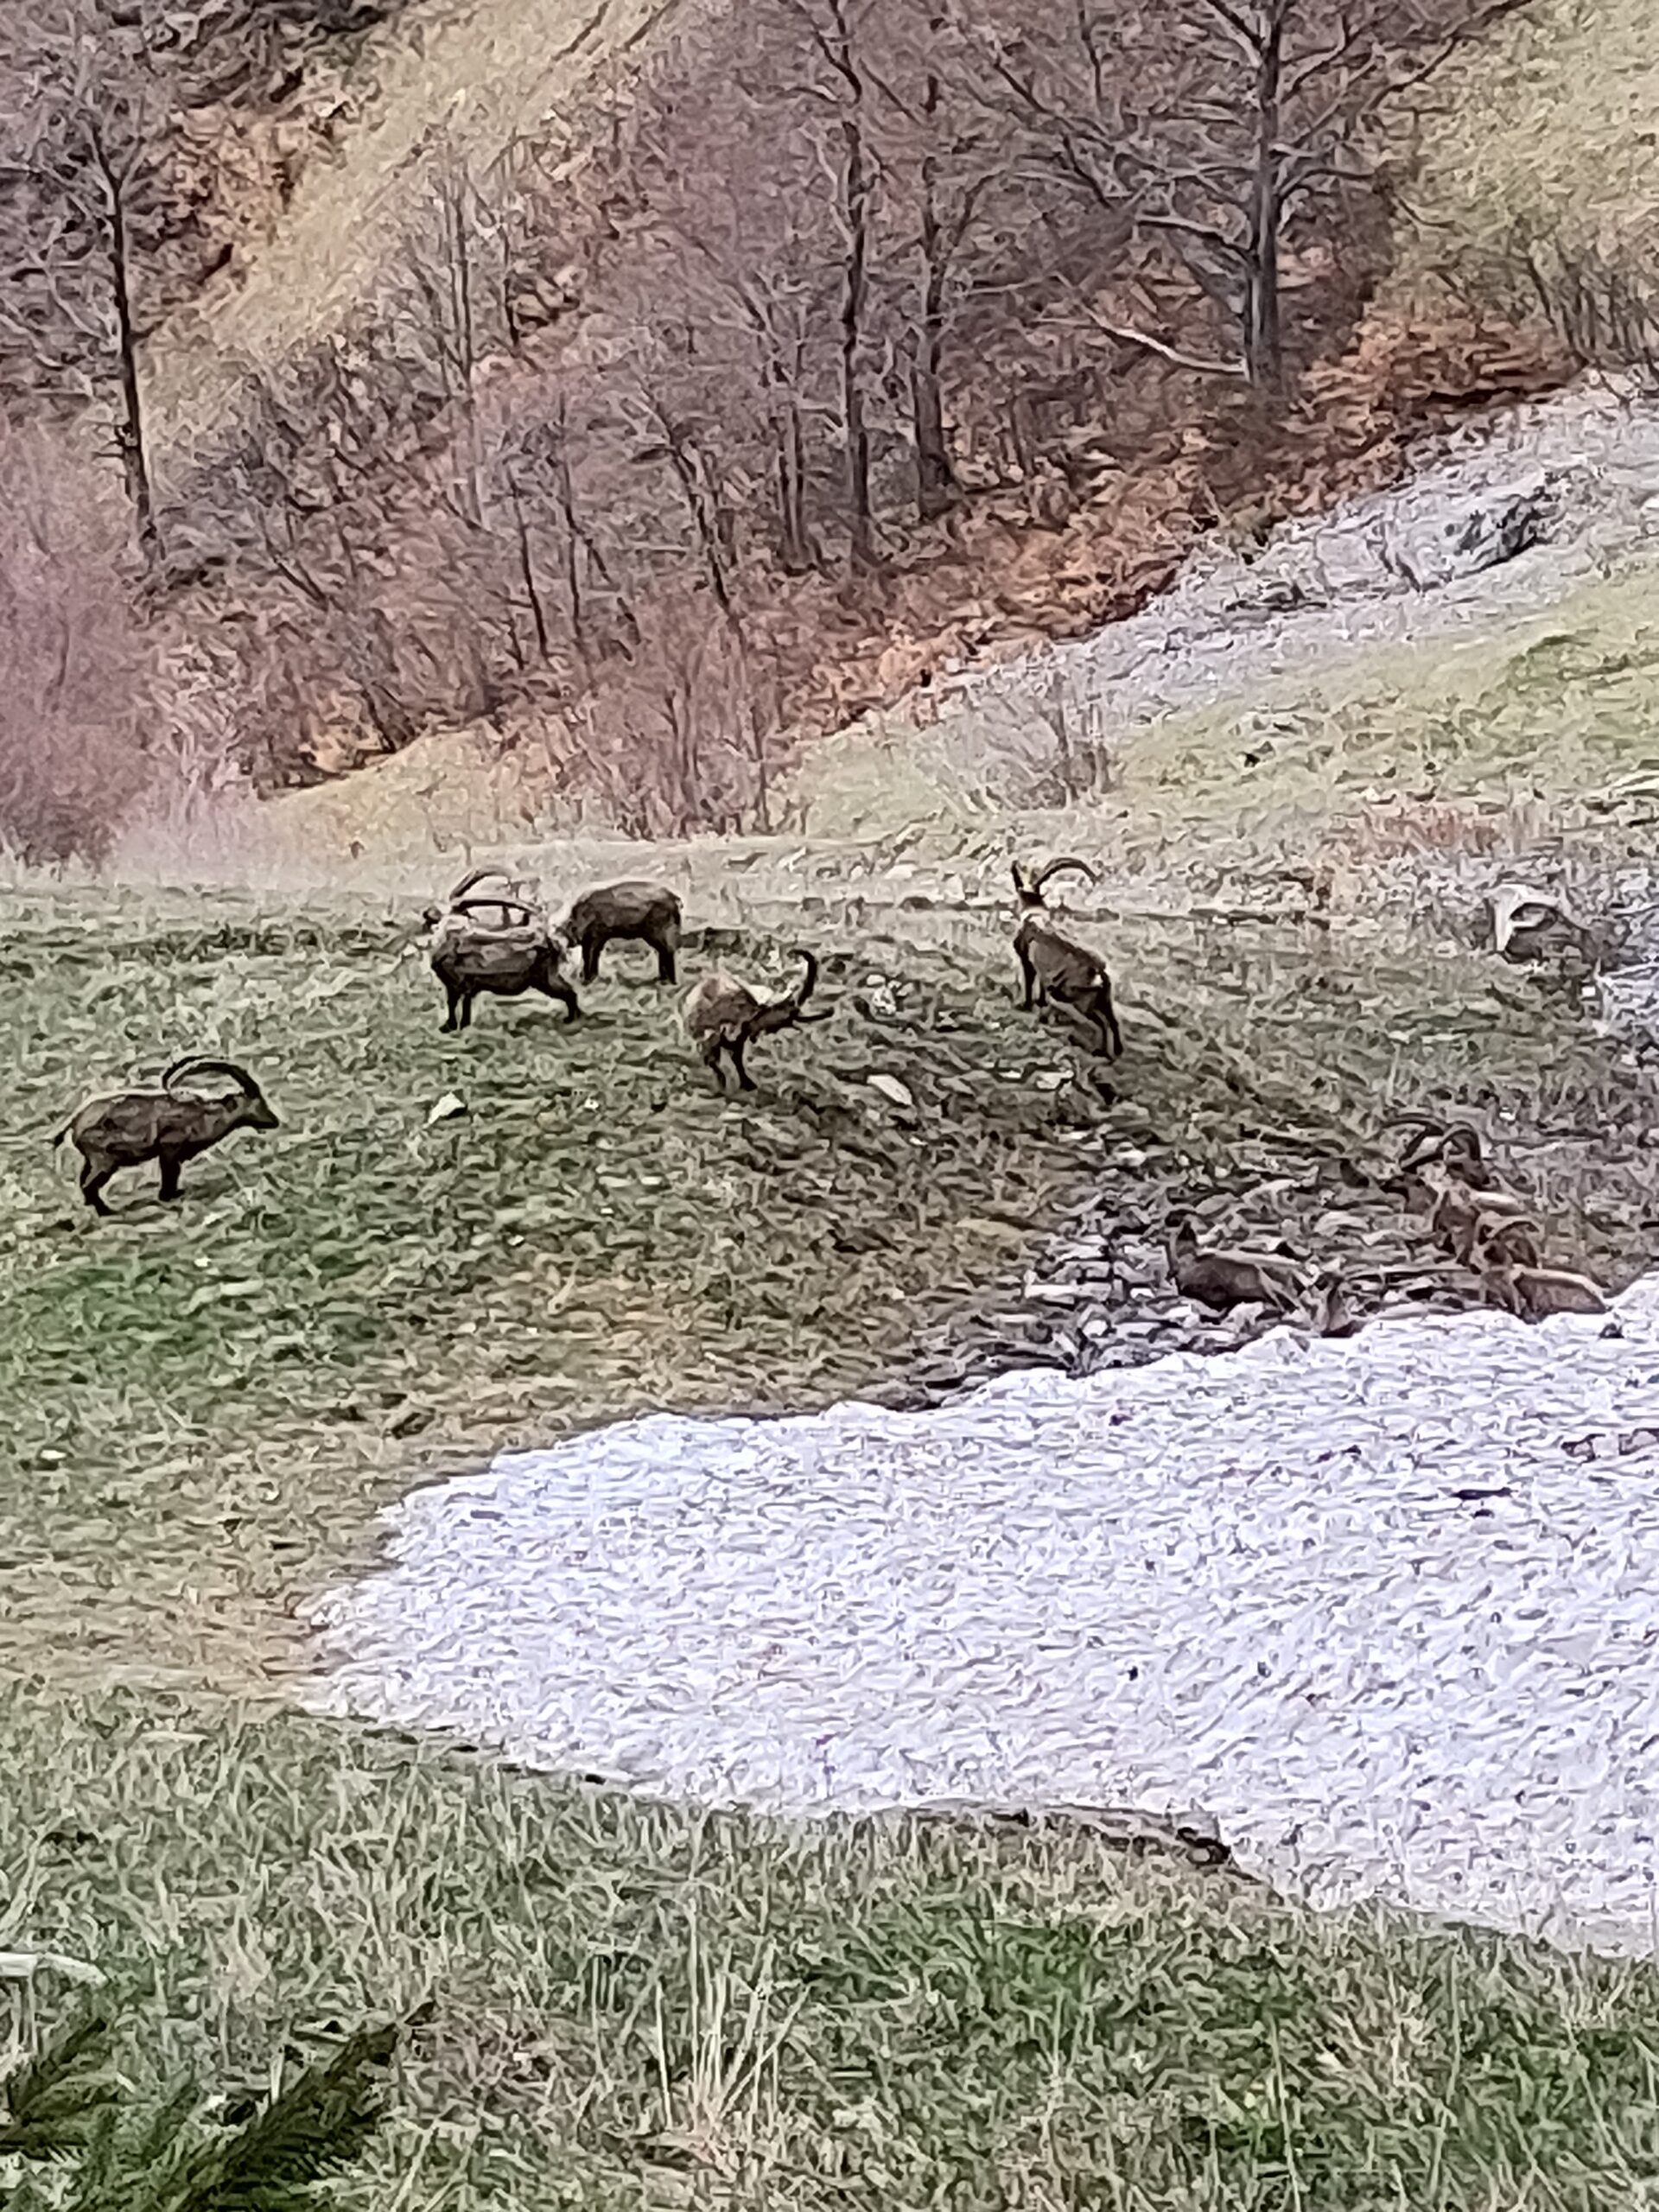
But who would spend a month in Switzerland without going hiking? No one. So of course I also profited of the weekends to head out and up into the beautiful landscape. My favorite hike was below the Churfirsten above Walensee, where we encountered a herd of 15 male ibex, peacefully grazing right next to us. Amazing.
 |
 |
|
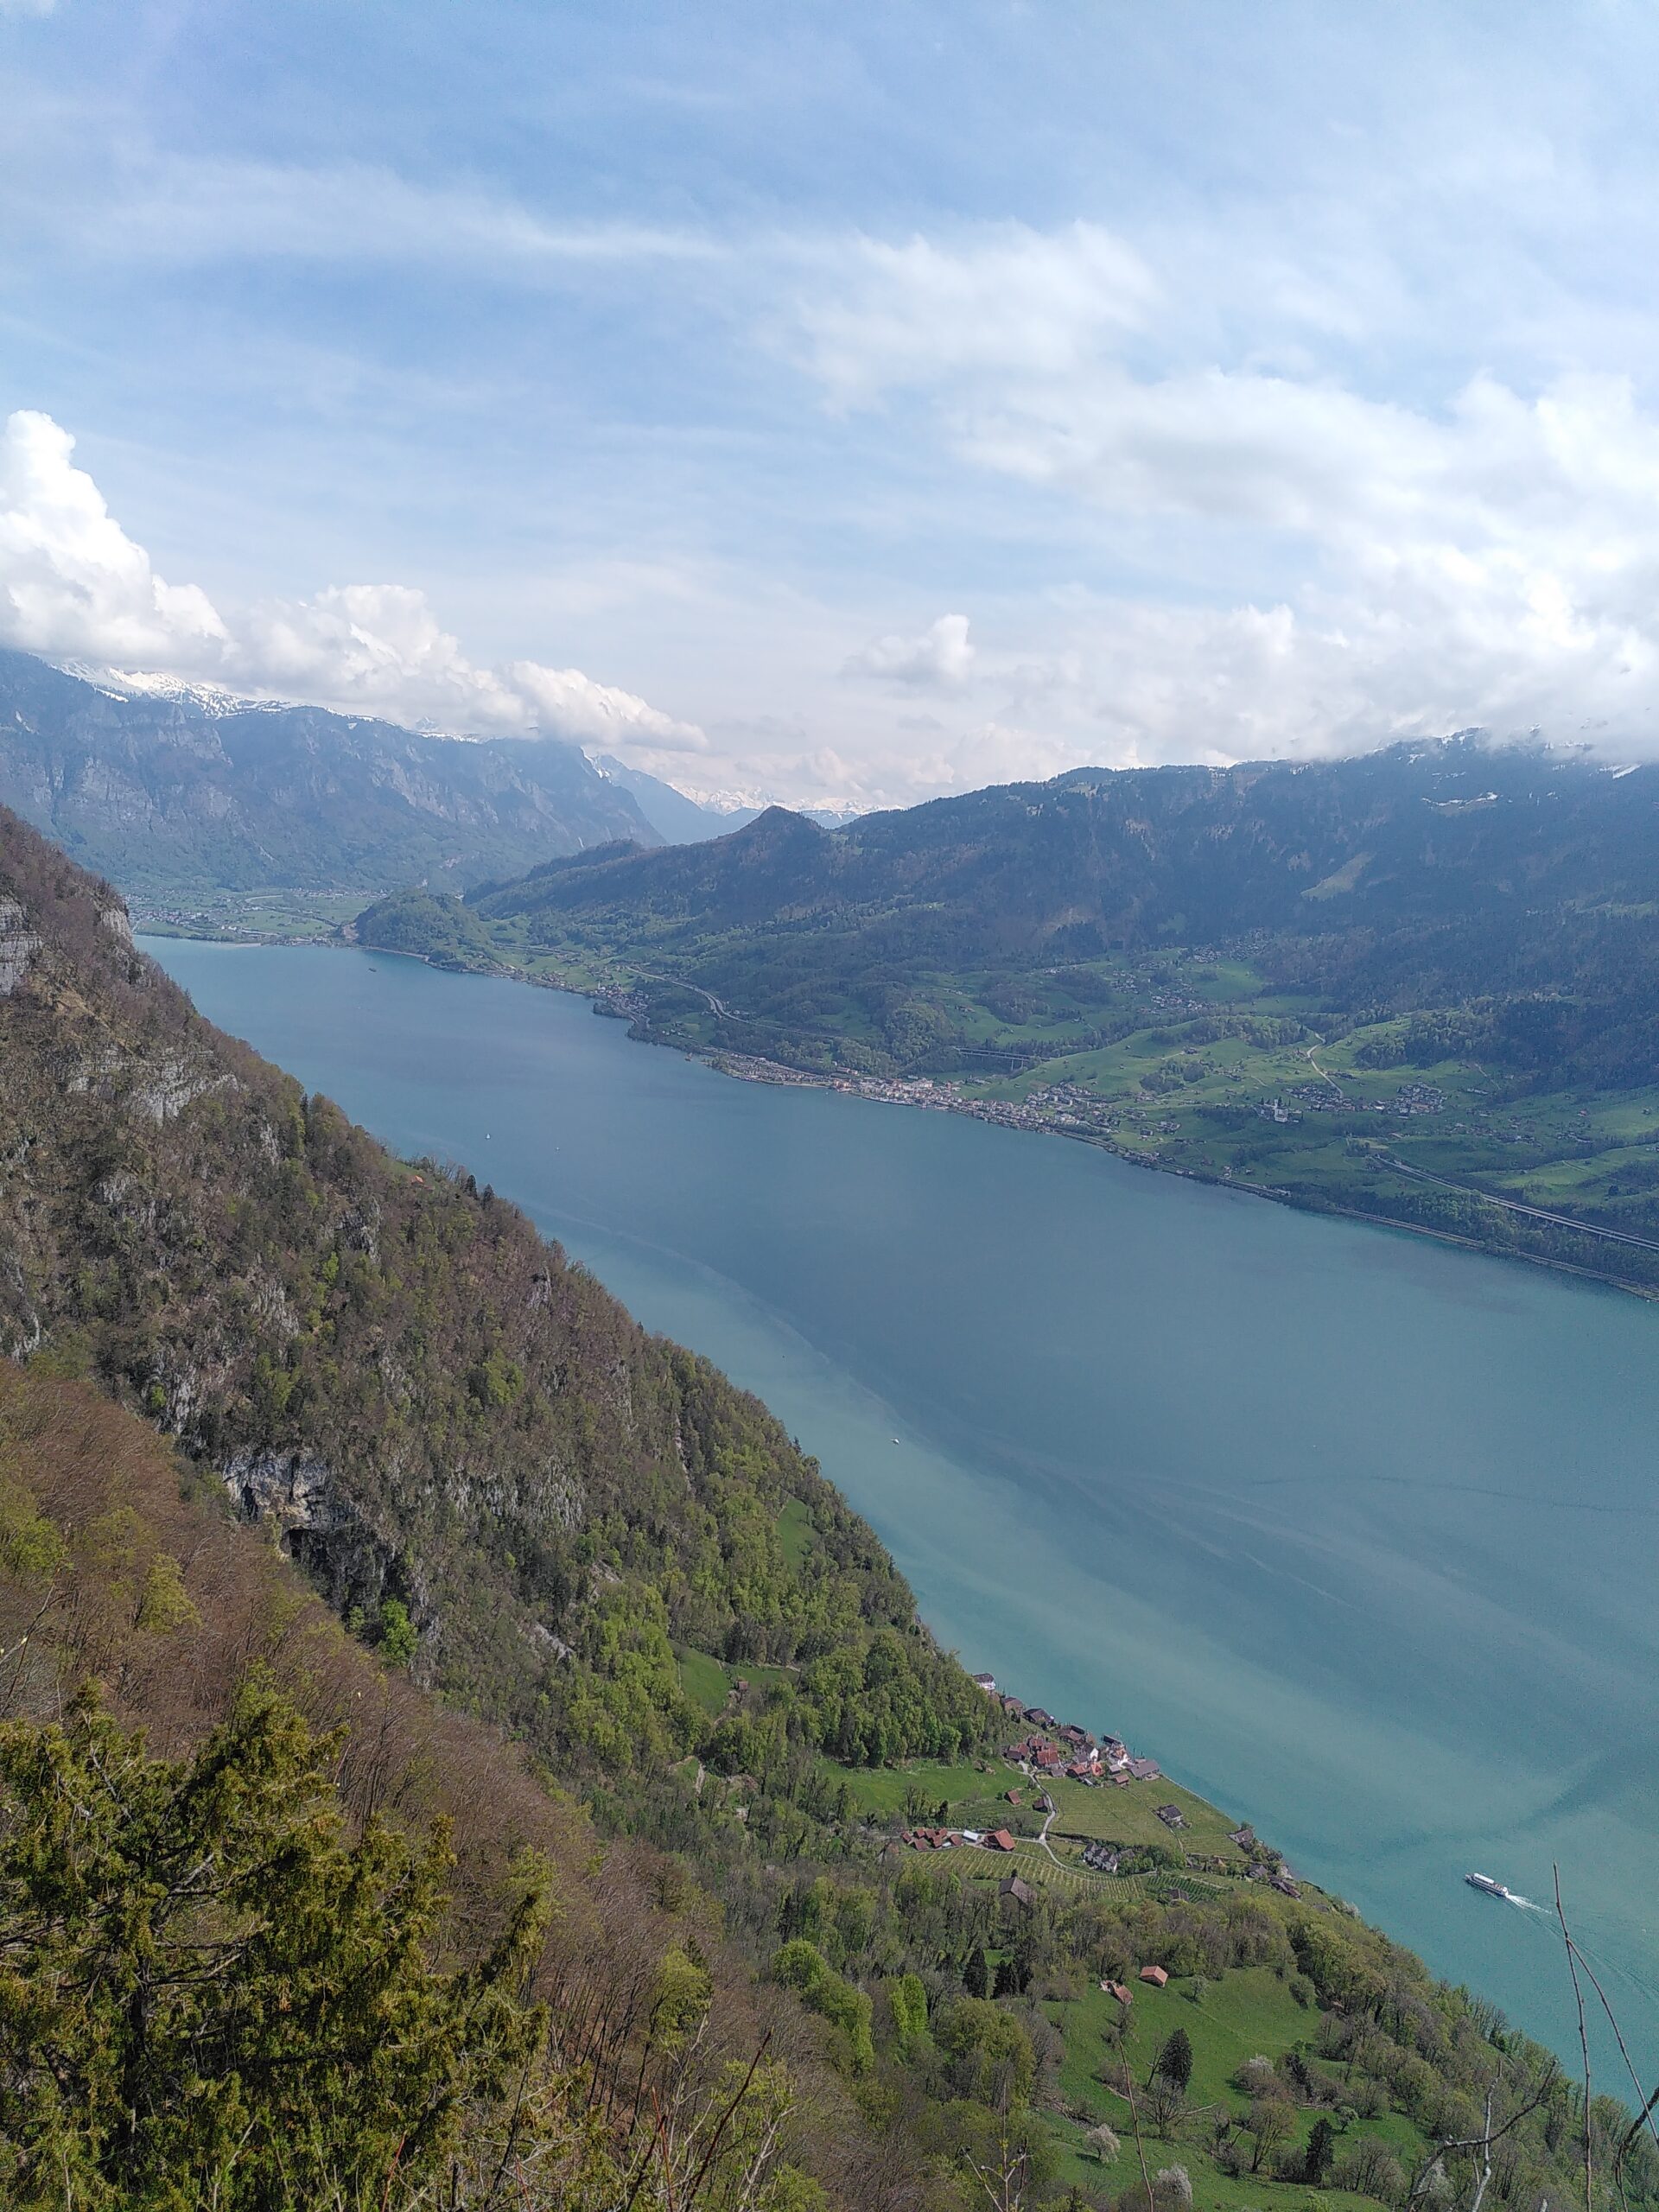
Lake Walensee in Switzerland |
Male ibex next to the hiking path |